Cart is empty
No reviews found


Do you know what products are sold most, or which month do you have the most sales? Or vice versa?
[DATAROU] Order Analysis Pro provides additional features with existing Order Analysis addon.
How to install?
1. Go to Add-ons > Manage add-ons.
2. Click [+](Upload & install add-on) button.
3. Click [Local] button and select zip file of this addon.
4. Click [Update & install] button.
How to use?
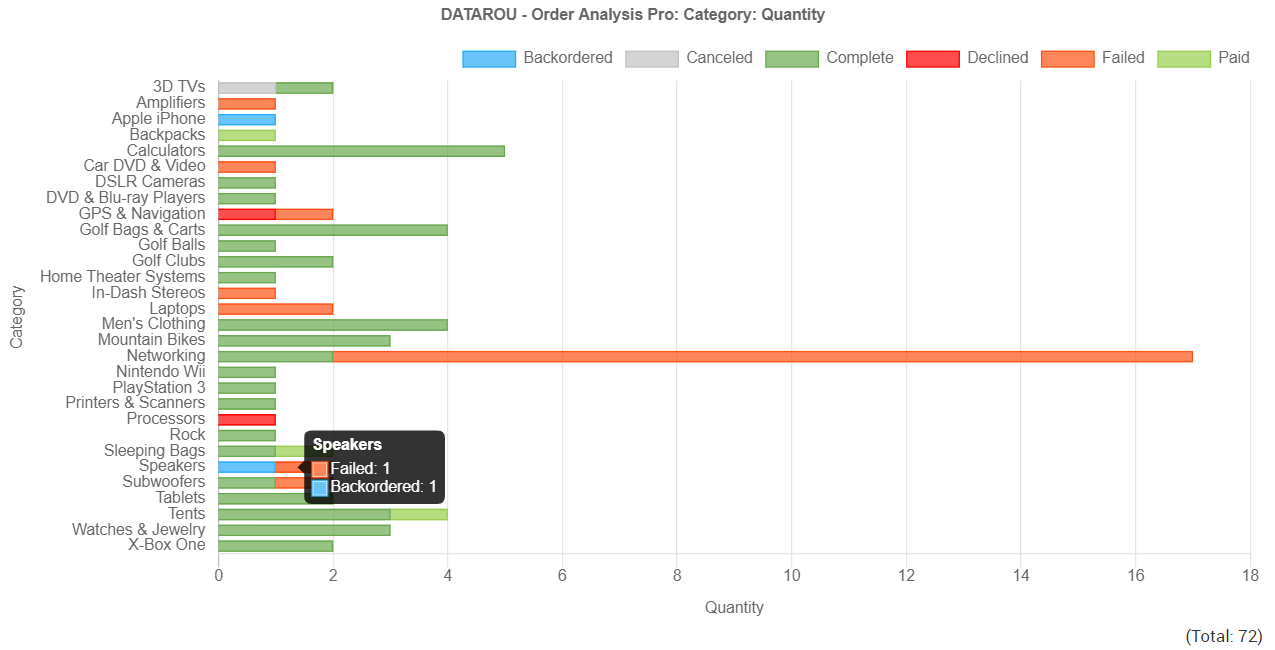
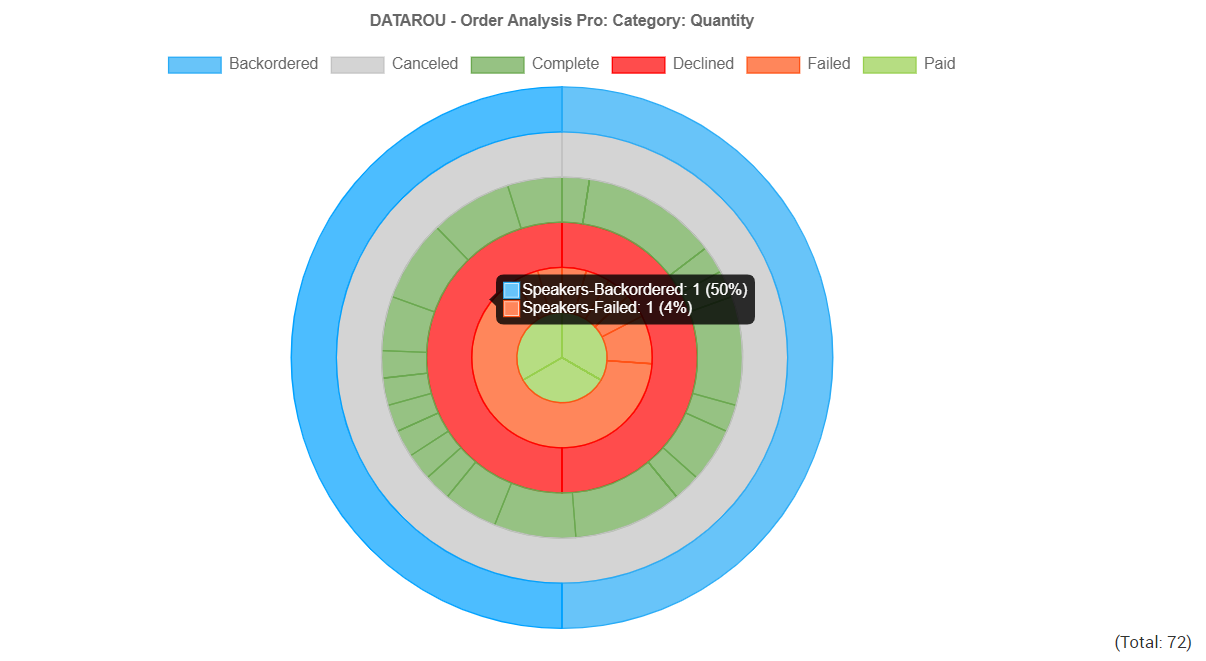
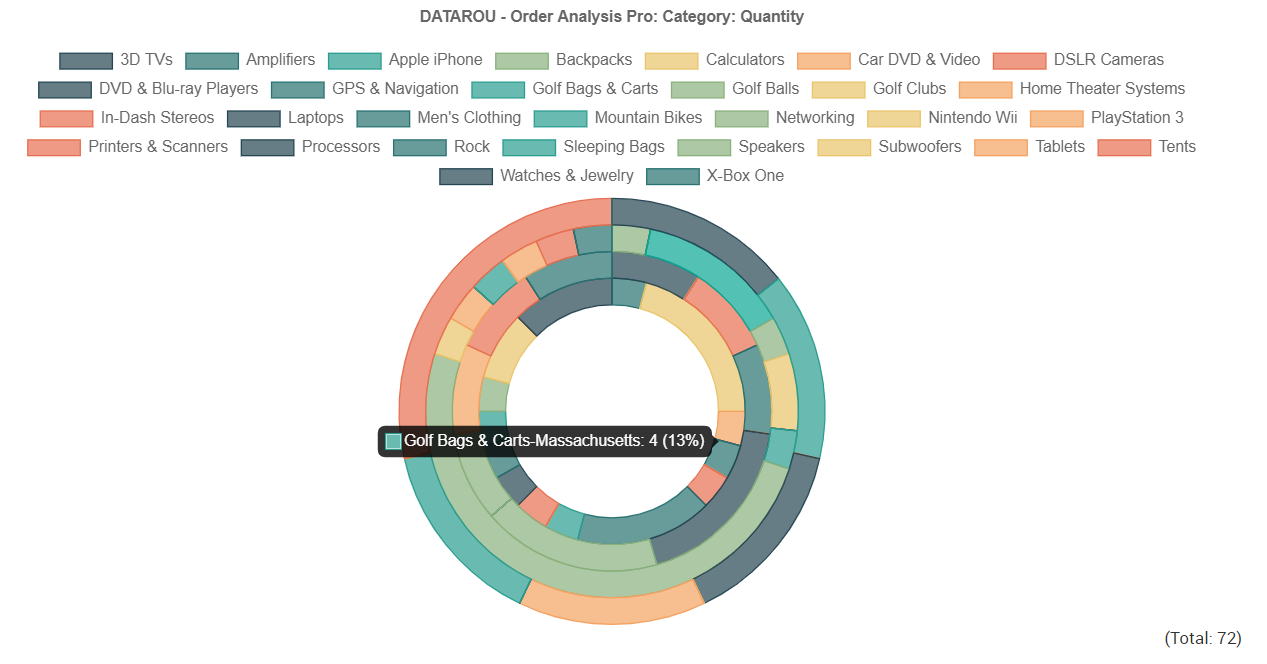
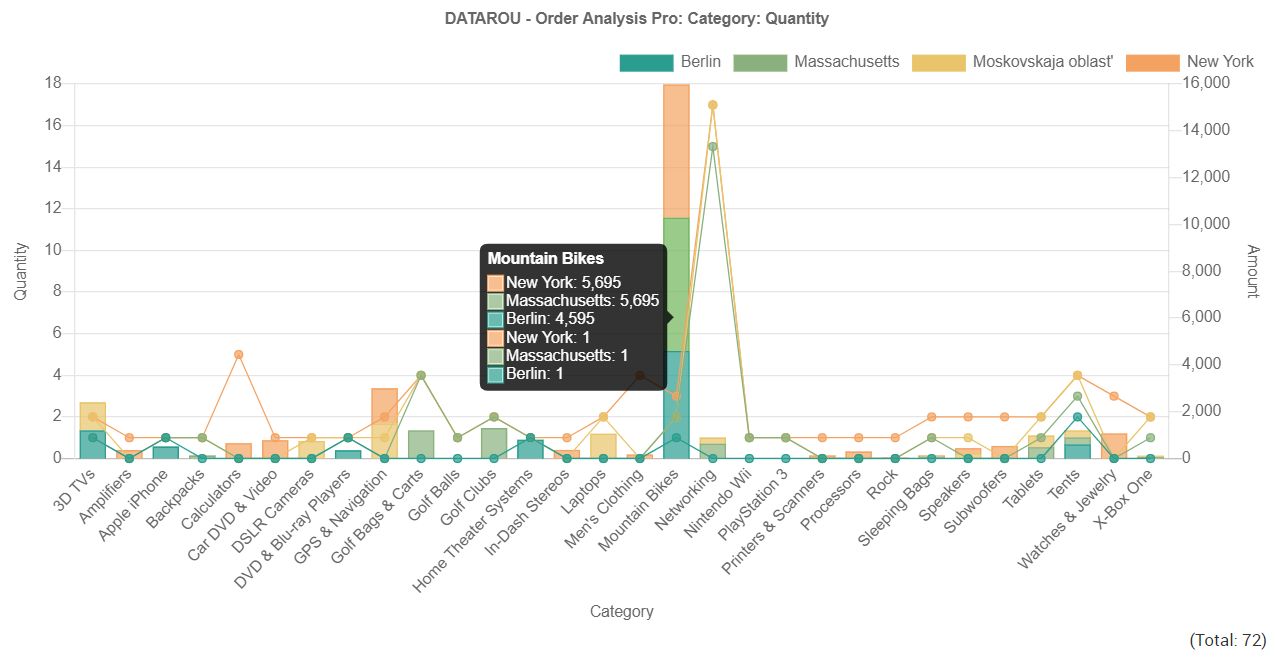
This is powerful tool to analyze your order data by charts.
1. Go to Orders > DATAROU - Order Analysis Pro.
2. Select chart conditions and click [Show Chart] button.
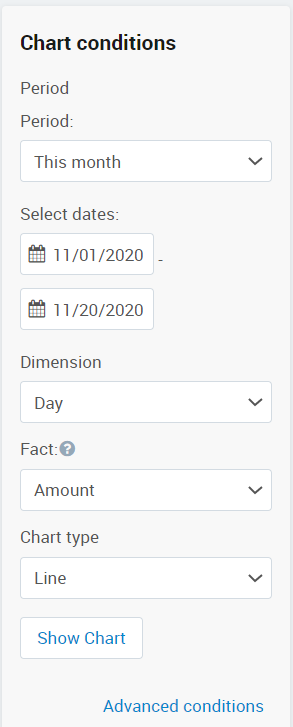
Dimensions: Year, Month, Day, Customer, Order Status, Order ID, Store(Vendor), Shipping method, Payment method, Shipping country, Shipping state, Category, Product.
Fact: Amount, Quantity
*When selecting dimension of Category and Product, Amount is product price ordered and Quantity is product quantity ordered. Otherwise, Amount is order amount and Quantity is order quantity.
Chart Type: Line, Column, Bar, Pie, Doughnut, Combo
* You can use "Advanced conditions" to narrow down your data.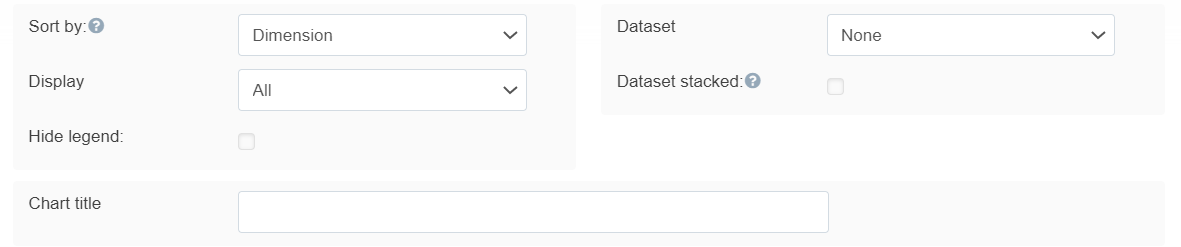
Sort by: Dimension, Top, Bottom
* Dimension of Year/Month/Day with Line/Column chart does not affect Top/Bottom sort. It always sorts by Year/Month/Day.
Display: Display only the number of data points set here.
Hide legend: Hide legend if checked.
Dataset: You can add additional dataset here.
Dataset stacked: If checked, dataset will be displayed as stacked. Only works for Column and Bar chart.
Chart title: Top title of chart.
*You can save your chart with [Save] button at "Save this conditions as".

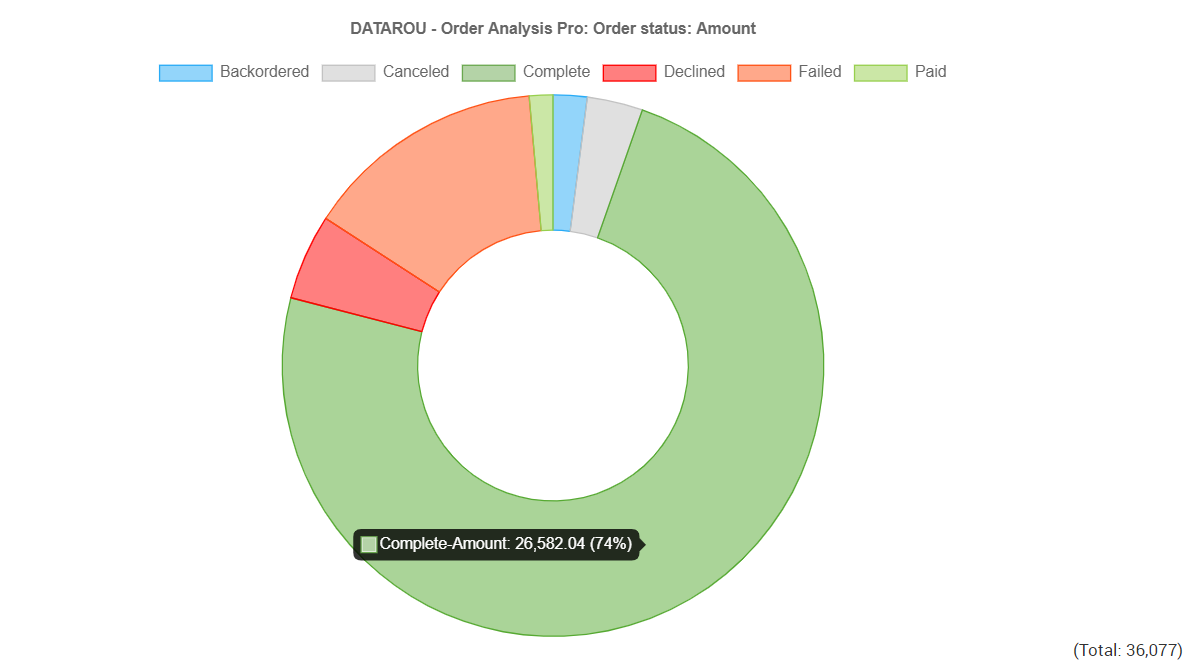
*For dimension or dataset of "Order status" the chart color is based on order statuses' color.
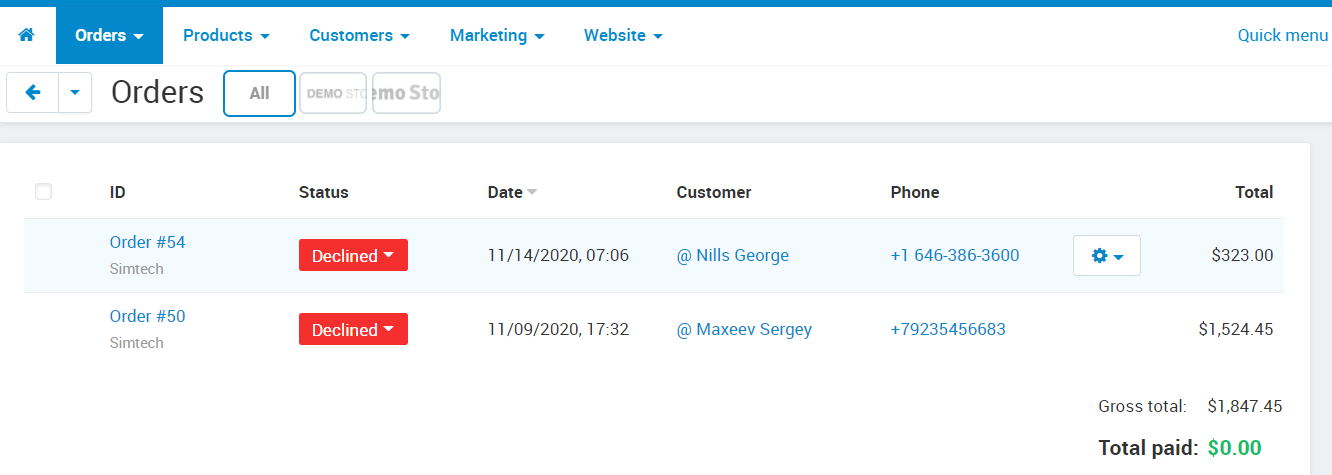
*Clicking on chart will open orders list on new tab for clicked data.
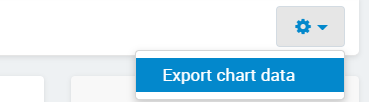
*You can export chart data to csv file.
*There are many settings of condition, chart and export. Please go to Add-ons > DATAROU > Order Analysis Pro.
[Condition settings]
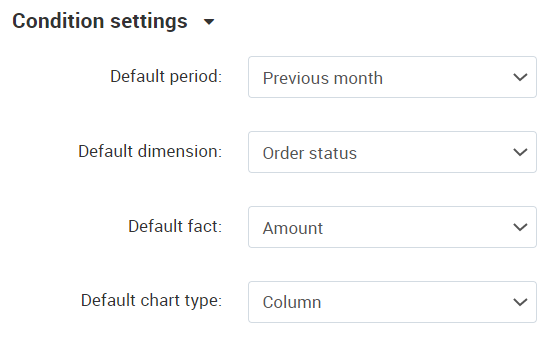
Default period: Set default period for chart conditions.
Default dimension: Set default dimension for chart conditions.
Default fact: Set default fact for chart conditions.
Default chart type: Set default chart type for chart conditions.
[Chart settings]
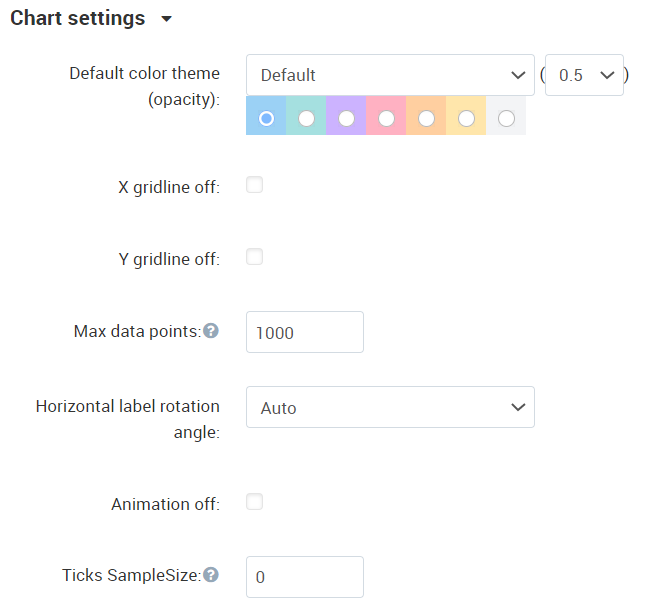
Default color theme (opacity): Select default color theme(color) and opacity of chart.
X gridline off: Hide X grid line from chart if checked.
Y gridline off: Hide Y grid line from chart if checked.
Max data points: Maximum number of data points which can display on chart.
Horizontal label rotation angle: Set Horizontal label rotation angle.
Animation off: Chart animation is off if checked.
Ticks SampleSize: The number of ticks to examine when deciding how many labels will fit. Setting a smaller value will be faster, but may be less accurate when there is large variability in label length. Set 0 is auto.
[Export settings]
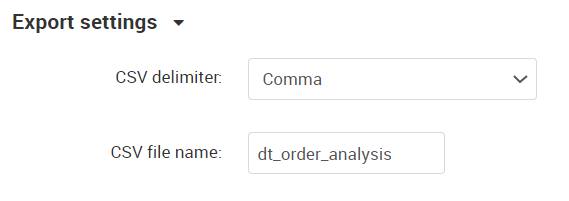
CSV delimiter: Set delimiter of CSV file for exporting chart data.
CSV file name: Set file name prefix of CSV file for exporting chart data.
No reviews found
We provide CS-CART addons mainly for dashboard, chart, export etc. of data related addons.


